We identified $180,000 in annual savings opportunities in the first three months. One building had HVAC running 24/7 due to a stuck sensor.
Energy Management for Schools
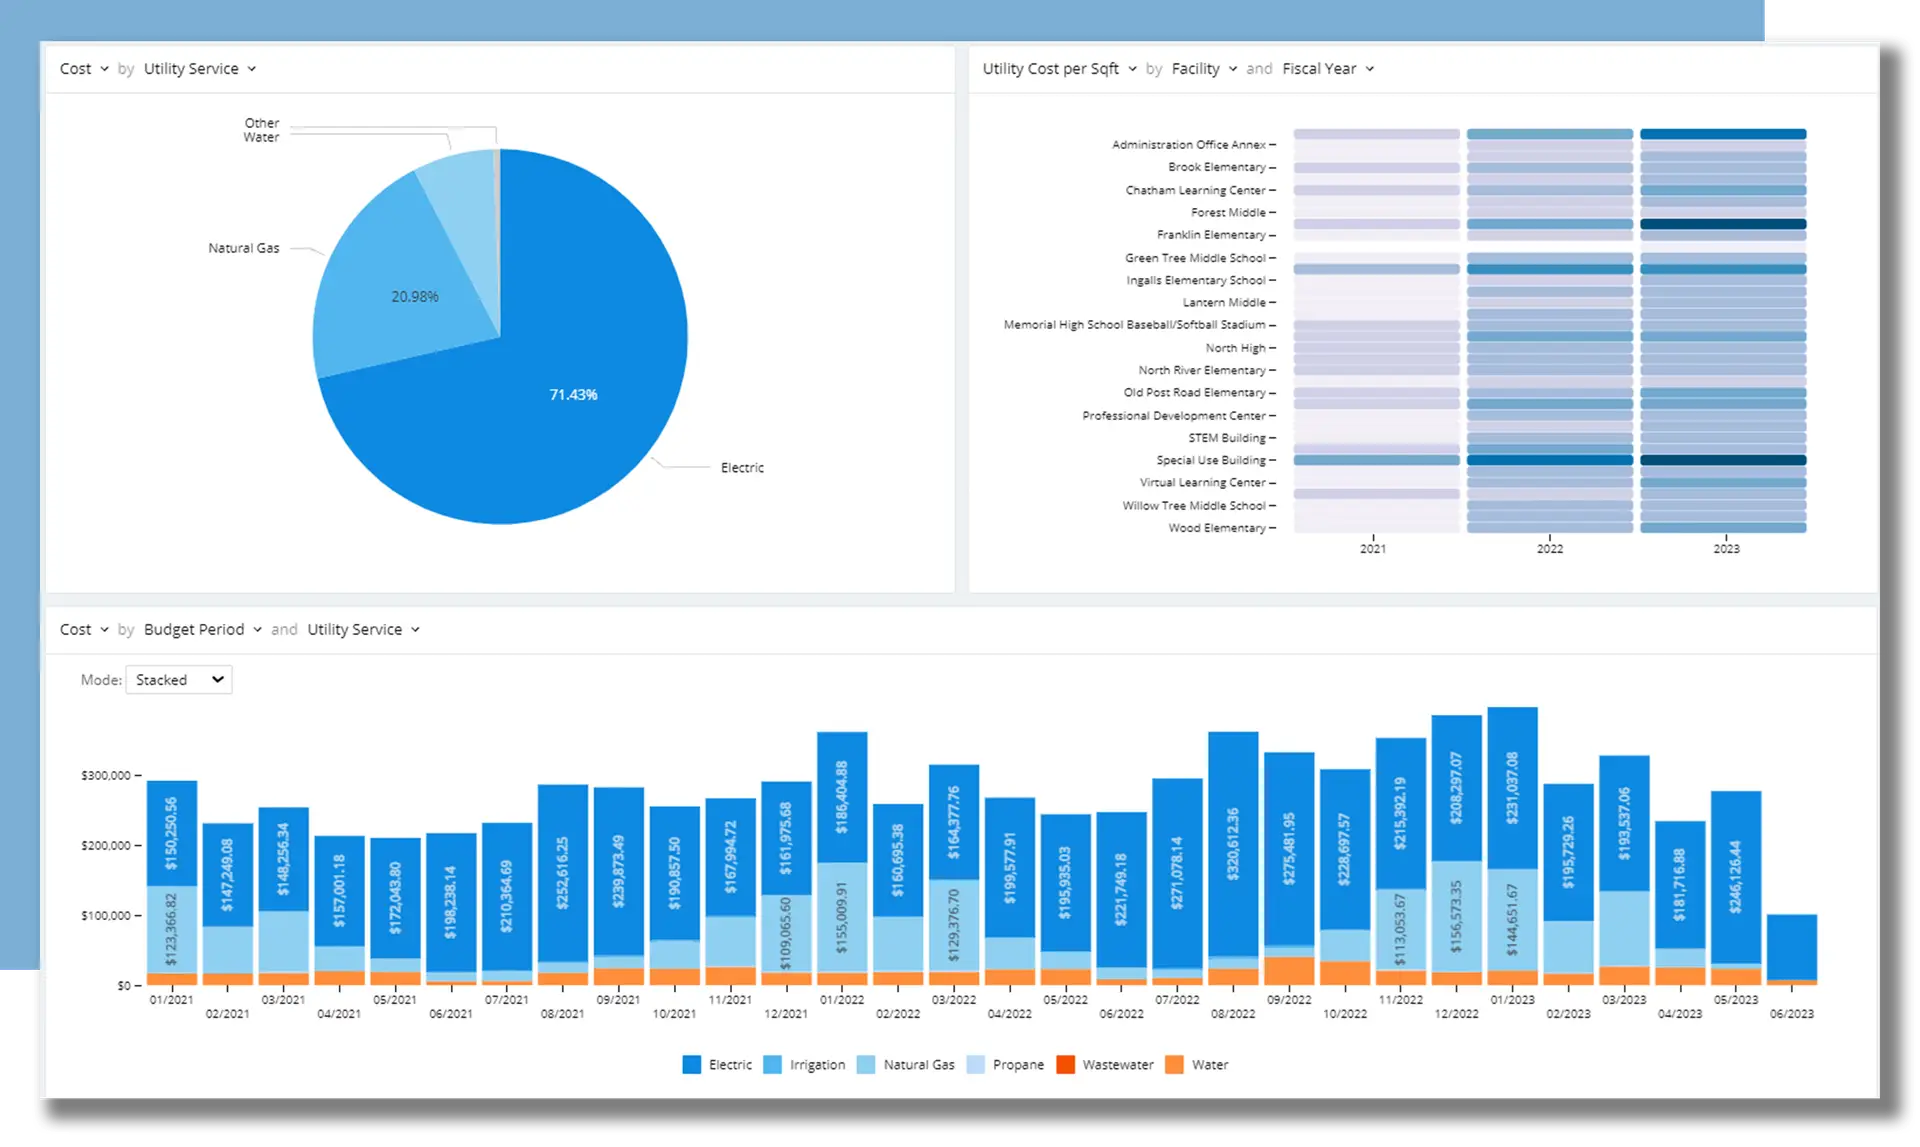
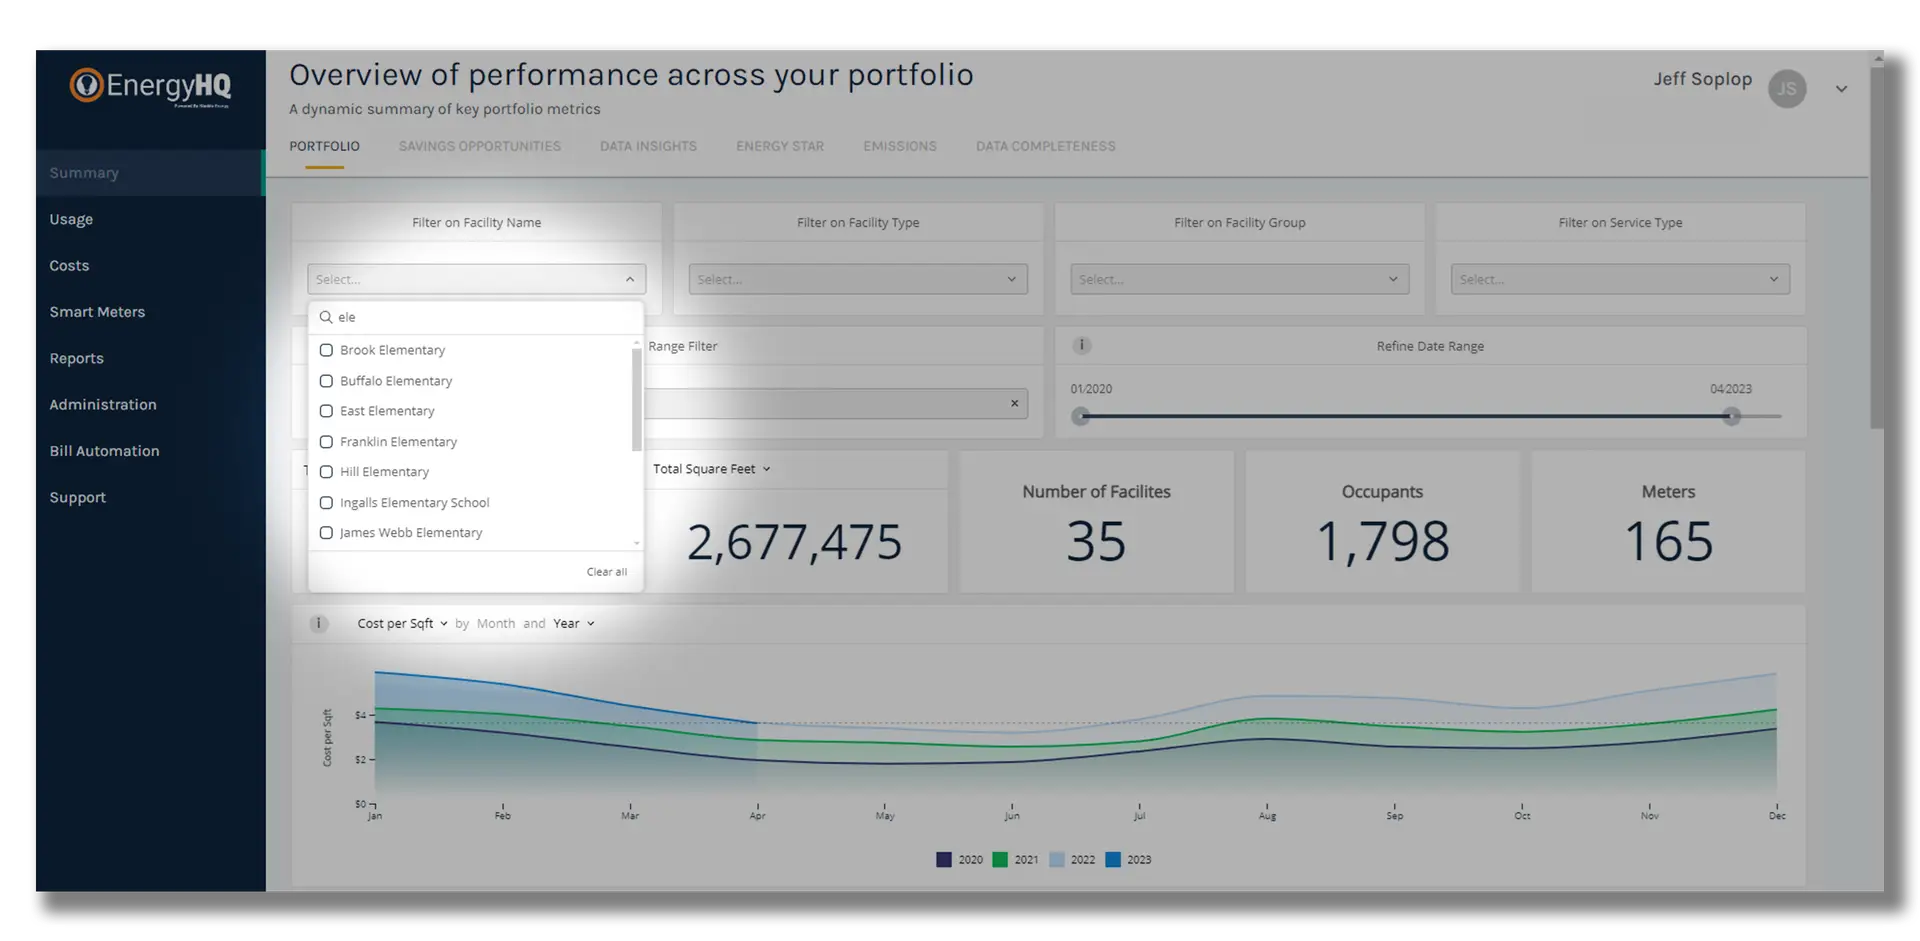
See Where Your Energy Goes
Utility costs are your second-largest expense. Monitor usage across every building, identify waste, and make data-driven decisions that reduce costs.

Screenshot coming soon
Everything You Need
Explore the key features that make Energy powerful yet easy to use.
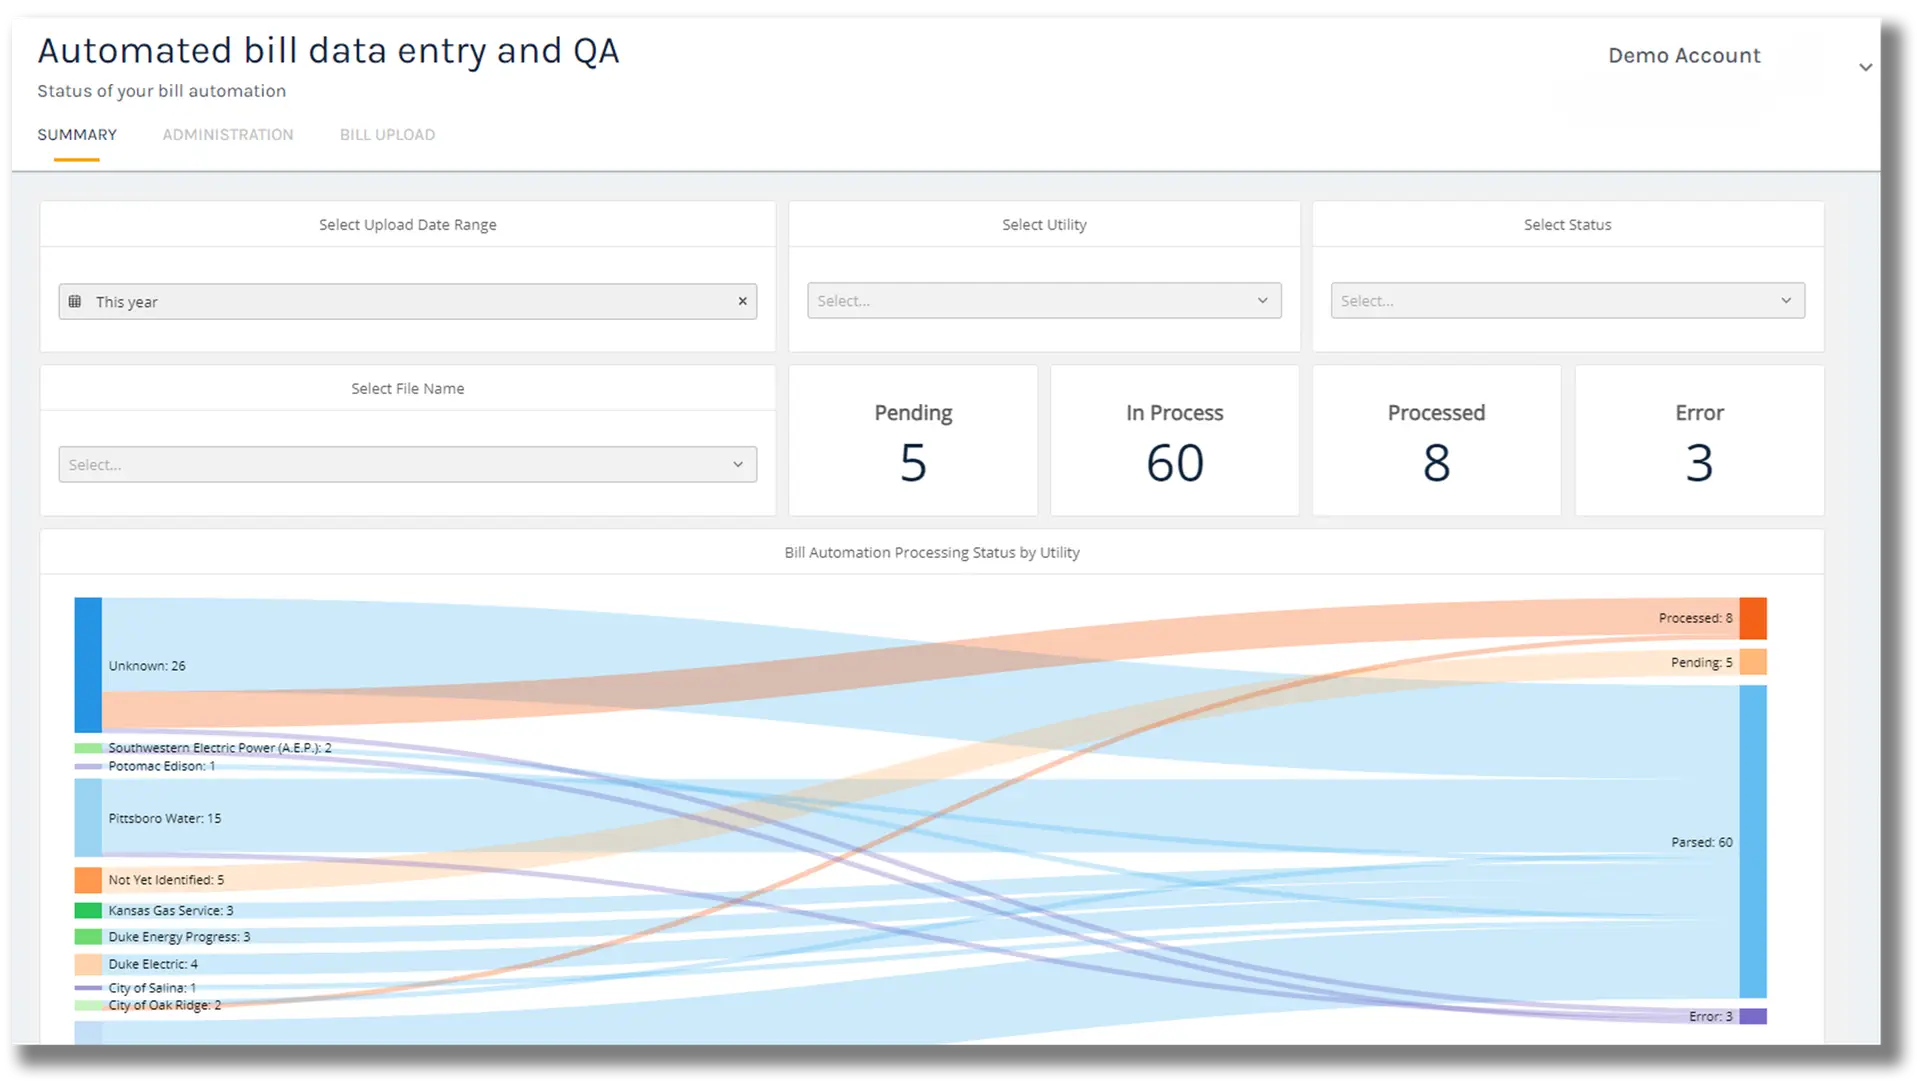
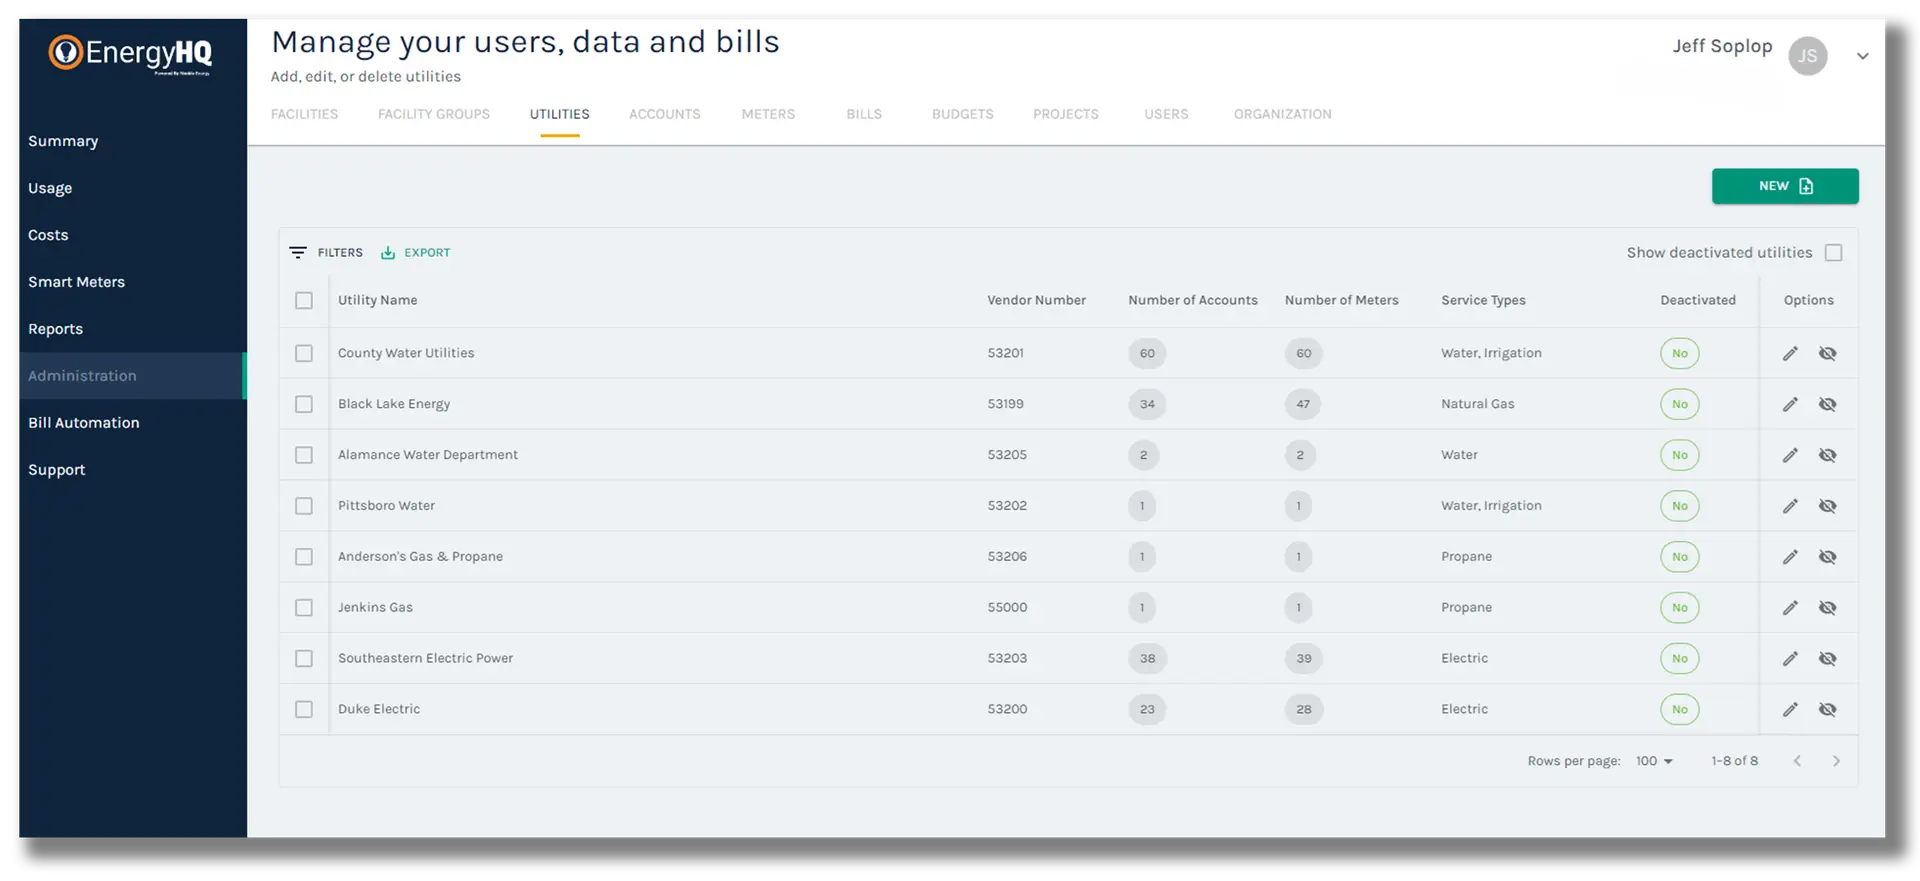
Data Automation
Automate utility data collection and processing
- Automatically pulls utility data from multiple sources
- Eliminates manual data entry and processing errors
- Streamlines data validation and classification processes
- Ensures timely, accurate energy data
- A faster, more affordable solution than manual processes
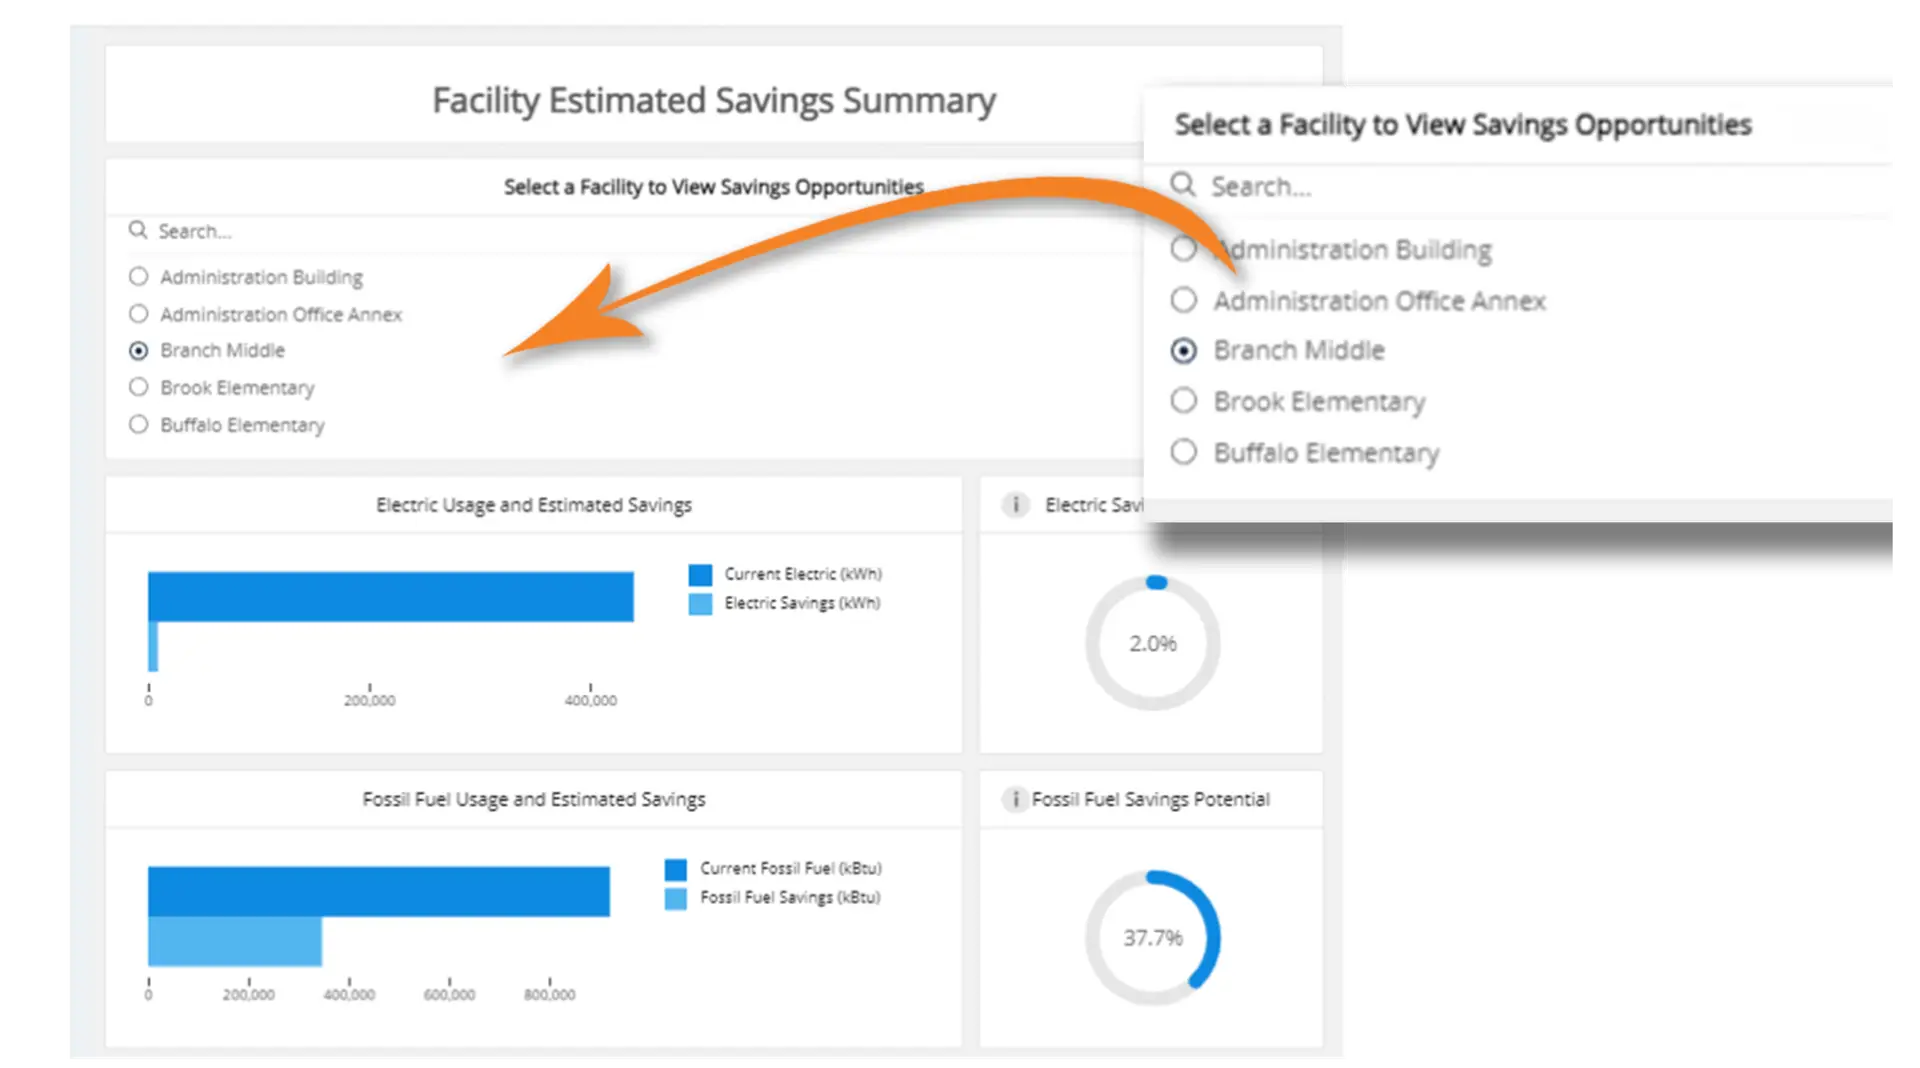
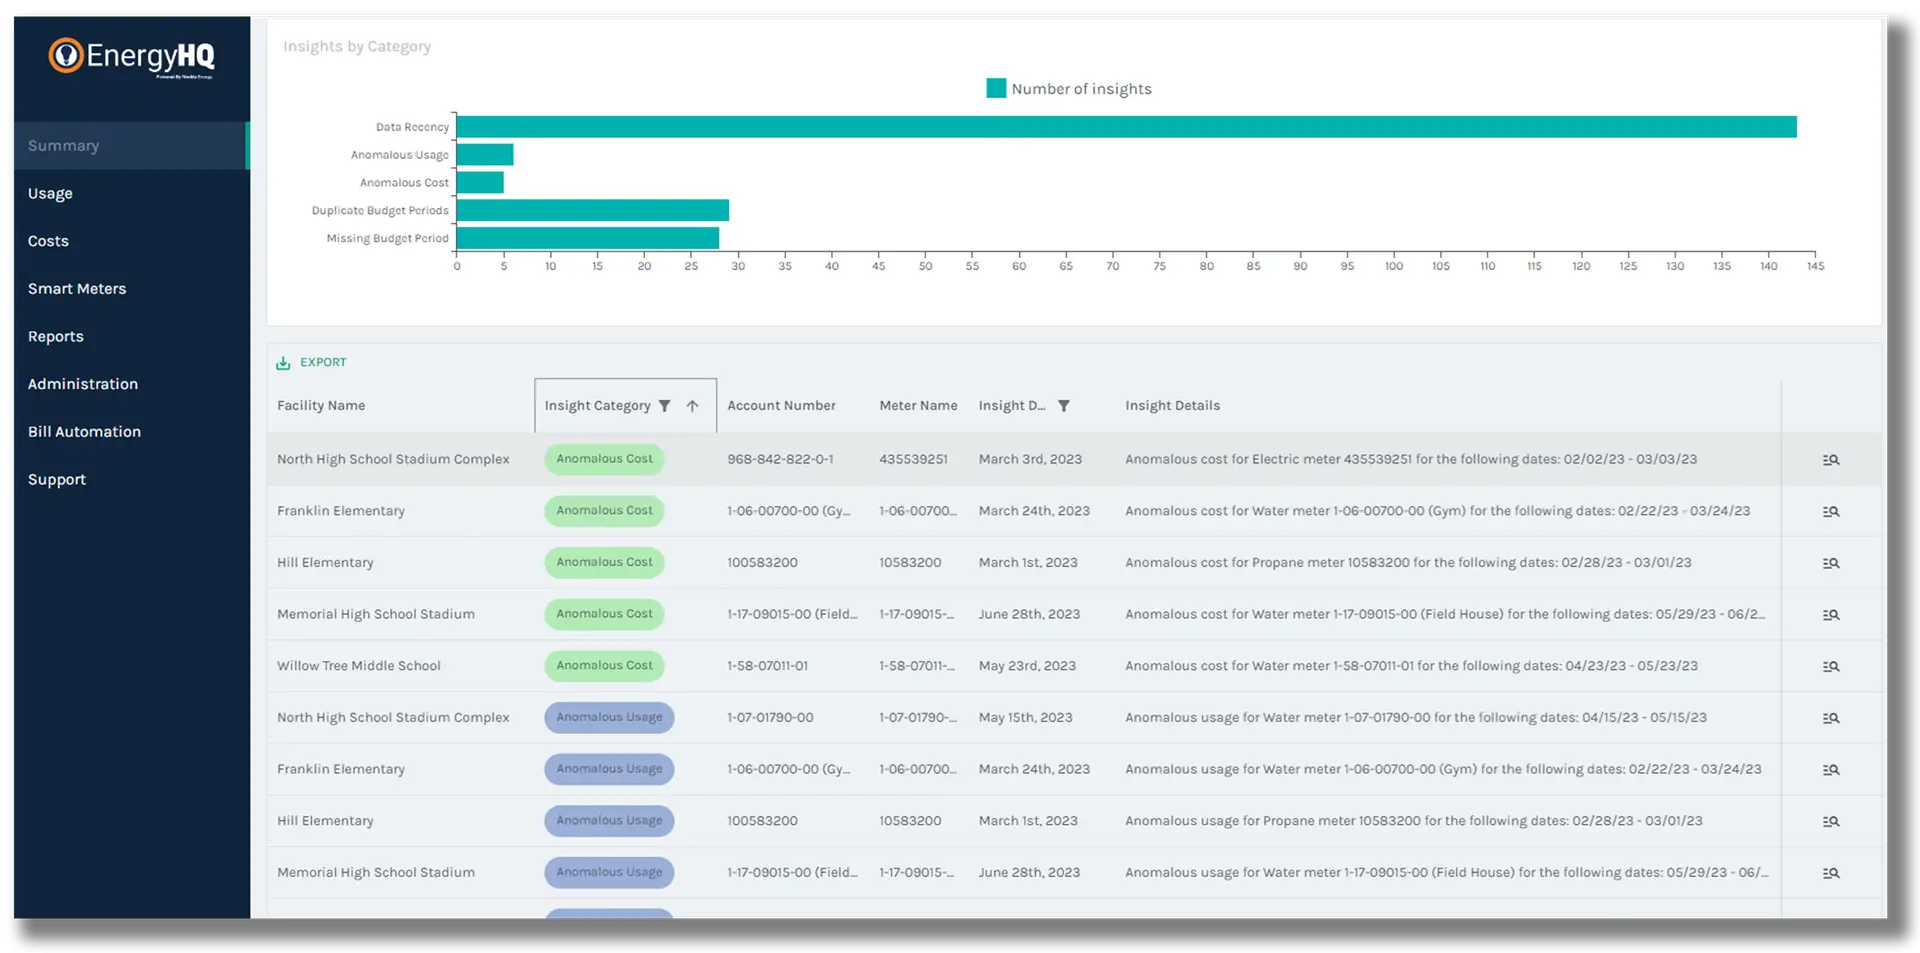
Proactive Insights
Get actionable recommendations from your energy data
- Detects cost-saving opportunities before they become issues
- Provides actionable recommendations based on real-time data
- Predicts trends and anomalies using advanced analytics
- Delivers custom insights tailored to your specific needs
- Automates notifications to ensure timely action
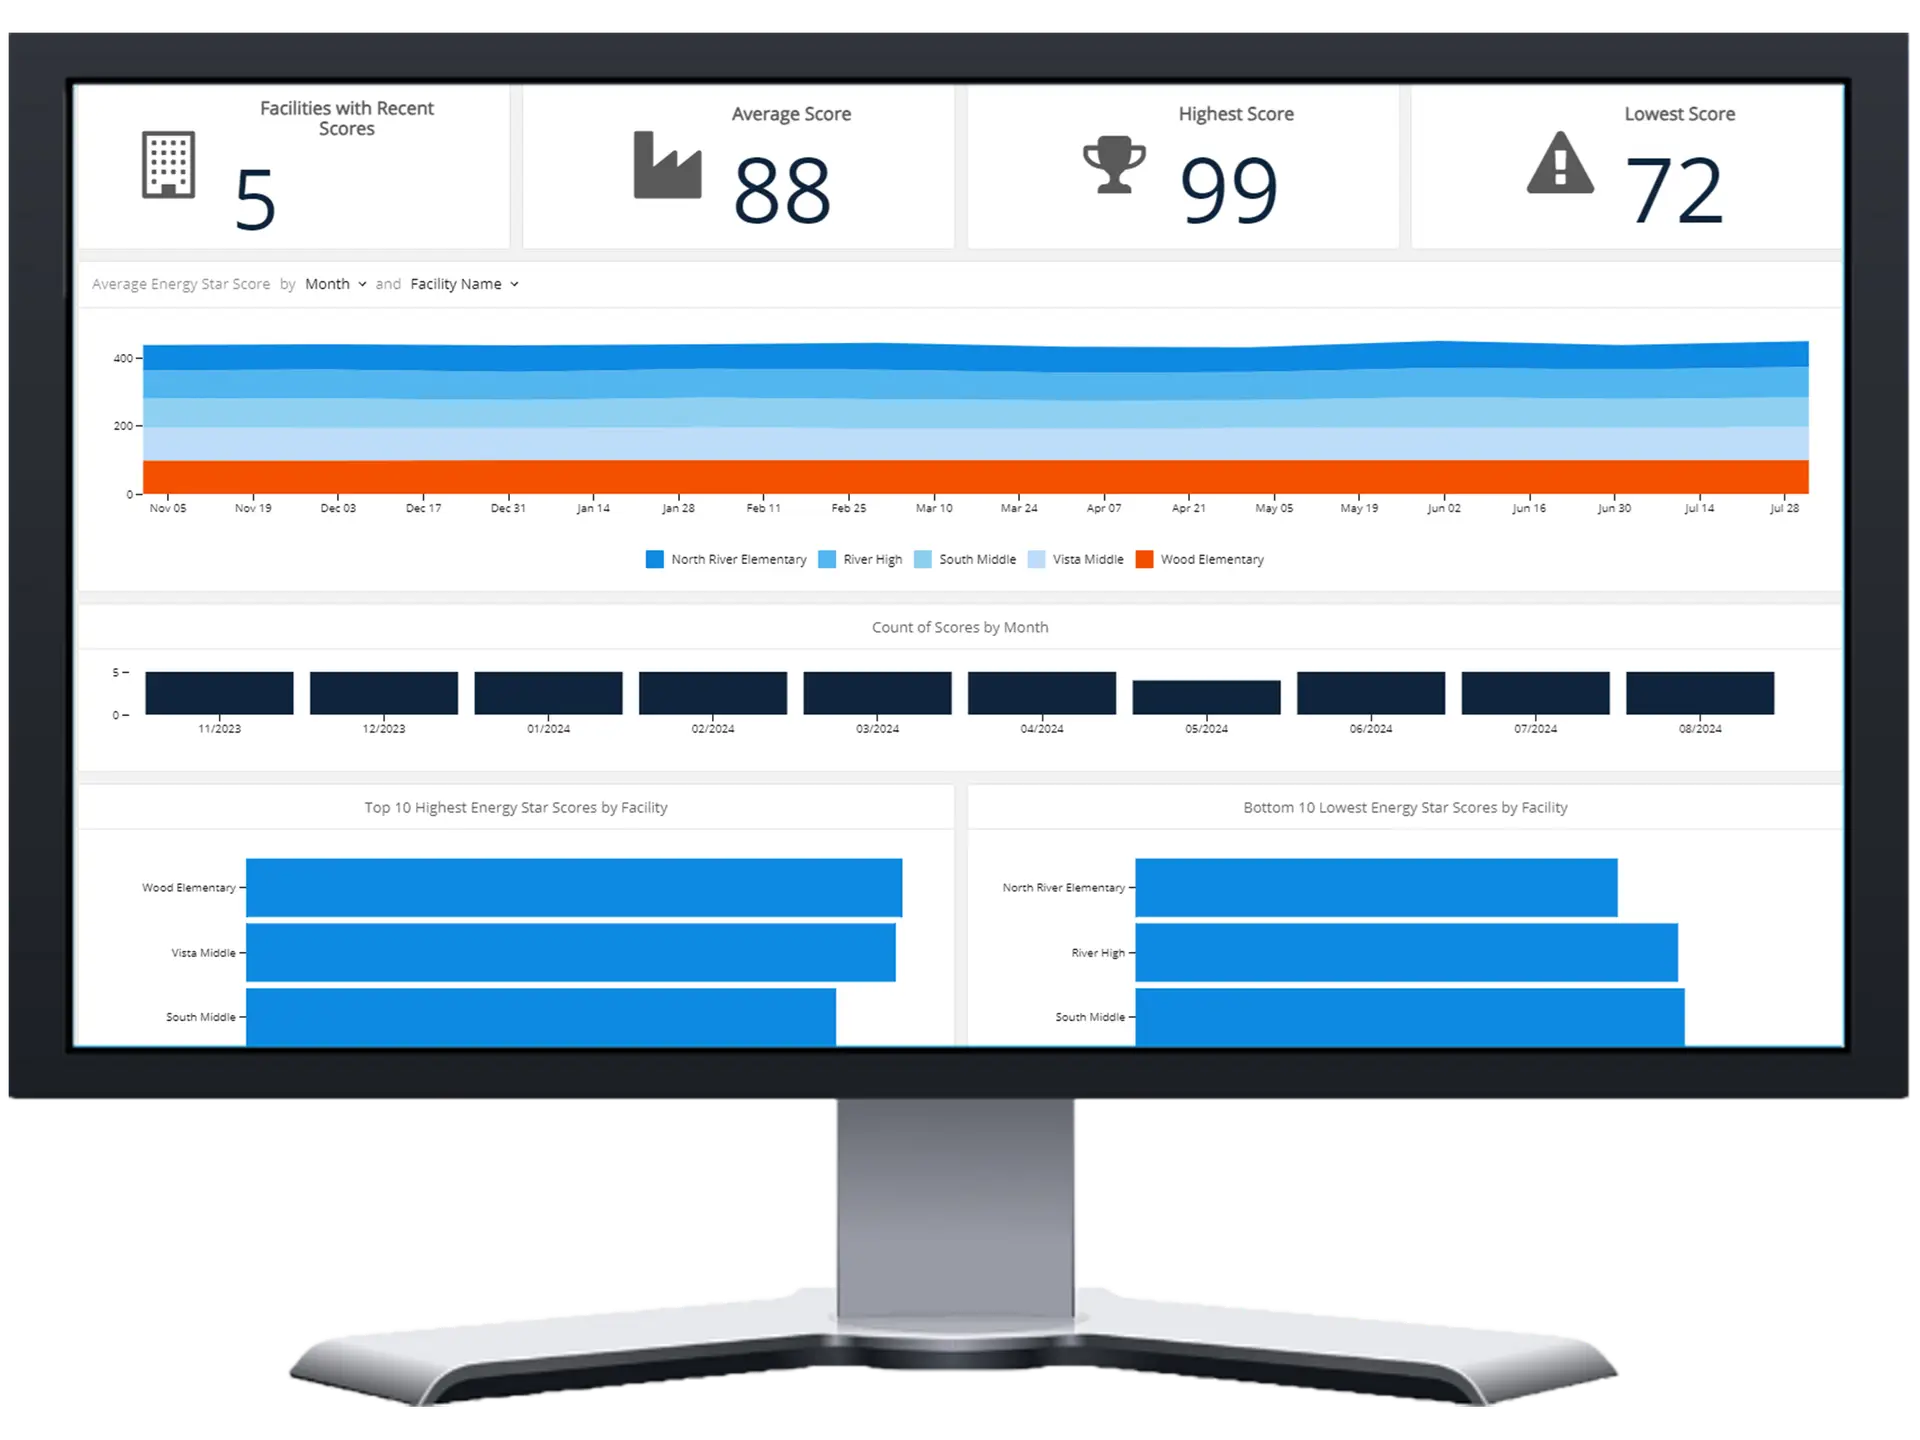
ENERGY STAR
Automated ENERGY STAR benchmarking and compliance
- Automatically integrates with ENERGY STAR® for effortless benchmarking
- Provides ENERGY STAR® scores and metrics without manual input
- Ensures compliance with ENERGY STAR® performance standards
- Simplifies tracking and ENERGY STAR® certification
- Saves time by automating ENERGY STAR® reporting processes
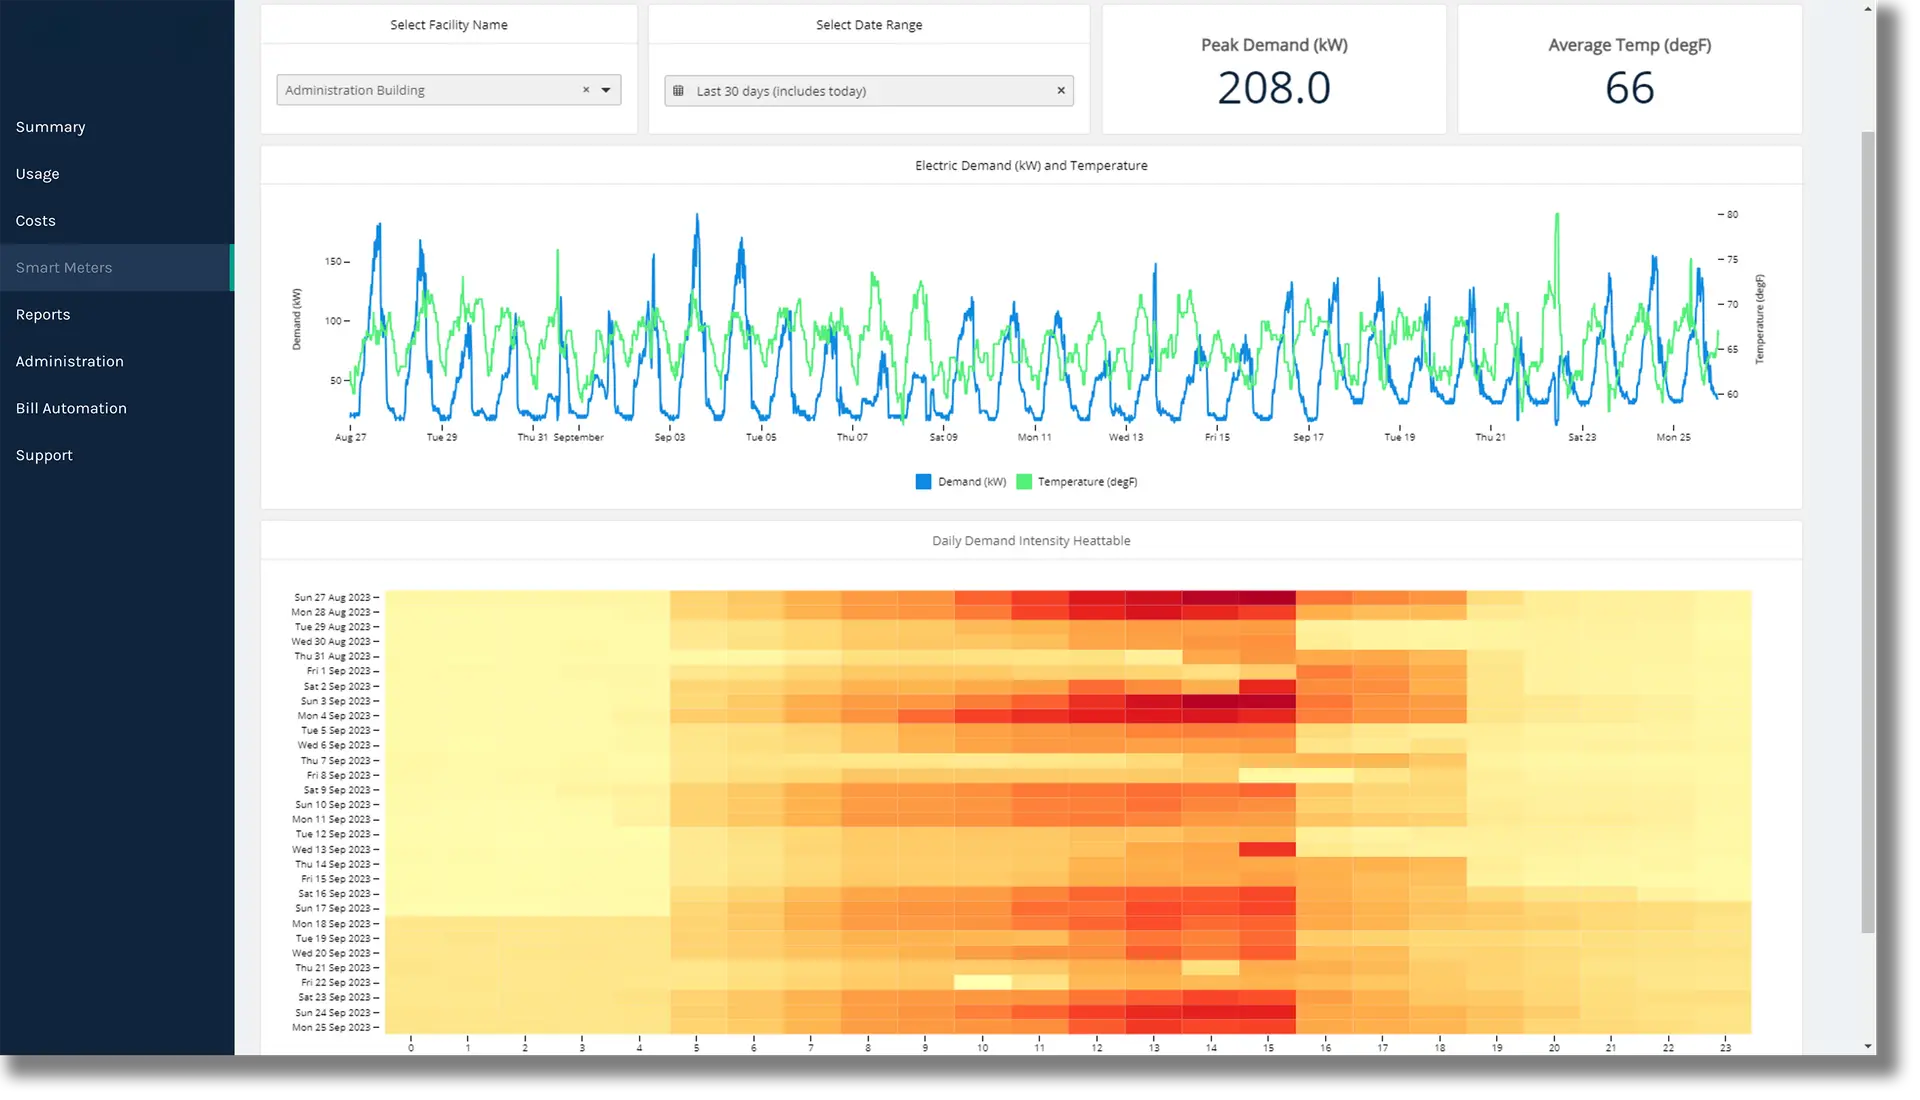
Extensible
Integrate with solar, EV charging, IoT, and more
- Easily integrates with solar, EV charging, interval meters, and control systems
- Supports IoT devices for advanced capabilities
- Recommends integrations based on ROI and cost-effectiveness
- Scales to accommodate new data sources and systems affordably
- Expands functionality without disrupting current workflows
Engagement
Engage stakeholders with custom dashboards and reports
- Custom public dashboards for external stakeholders
- Engages finance, operations, and management with tailored insights
- Provides tools for cross-department collaboration on energy goals
- Customizable reports and visualizations for various audience needs
- Keeps all stakeholders informed with intuitive, interactive visualizations
Easy To Use
Designed with ease in mind, EnergyHQ enables quick navigation and streamlined utility management.
- Clean interface with easy data exploration tools
- Quick setup with minimal configuration required
- No technical expertise needed for everyday use
Flexible
EnergyHQ adapts to your unique needs, offering customizable features and seamless integration with existing systems.
- Easily scales with changing data requirements and technologies
- Customizable to match specific energy and budget goals
- Works with a variety of existing tools and systems
Advanced Functionality
EnergyHQ automates complex analysis, using advanced models and AI to uncover high-value insights without manual effort.
- Generates insights without requiring data science expertise
- Automates weather normalization and cost-savings analysis
- Uses AI to predict trends and extract actionable opportunities
Energy Capabilities
What You Can Do
Usage Dashboards
Visualize energy consumption across all buildings and meters
Anomaly Detection
Automatic alerts when usage patterns deviate from normal
Cost Tracking
Track actual utility costs and project future expenses
Benchmarking
Compare buildings by square footage, age, and use type
Weather Normalization
Account for weather when comparing periods and buildings
Reporting
Generate reports for board presentations and grant applications
Connected to HeroHQ
Works With Your Other Modules
Energy connects with Automation for alerts and responses, Planning for HVAC maintenance impact, and Work Orders when issues need attention.
Energy FAQ
Common Questions
-
We can connect directly to utility company data feeds, integrate with smart meters, or import utility bills manually. Most districts use a combination based on what's available.
-
Yes, we can monitor renewable energy production alongside consumption to show net energy use and track the ROI of your solar installations.
-
We integrate with major BAS platforms to pull data and, in some cases, respond to conditions. Talk to us about your specific systems.
-
The system learns normal patterns for each building and alerts you when usage deviates significantly—accounting for weather, day of week, and time of year.
Ready to streamline energy?
See how Energy fits into your facilities management workflow. Try it free or schedule a personalized demo.